
Amazon product seasonality analysis tells you in which months a product sells best, so stock arrives before the peak instead of during it. The statistics endpoint returns the recorded sales rank history since tracking began in one call. Compare each day's rank with the year around it, take the median per calendar month and keep only peaks that repeat every year. An index of 2.0 means that month's rank number was half the usual one. One credit per ASIN.
Key Takeaways
- One statistics call per ASIN returns the full recorded sales rank history and the history of Amazon's bought-past-month badge.
- The seasonal index compares each day's rank with the median of the 365 days around it, so a product that climbs or falls over the years does not look seasonal.
- A peak counts only when the month beats the usual rank in every year on record; a one-year deal or stock-out is reported as a one-off.
- The index is a rank ratio, not a sales ratio: how many more units a better rank means depends on the category.
- The analysis needs twelve calendar months with at least 20 ranked days each; statistics covers 11 marketplaces.
What does a seasonal index measure?
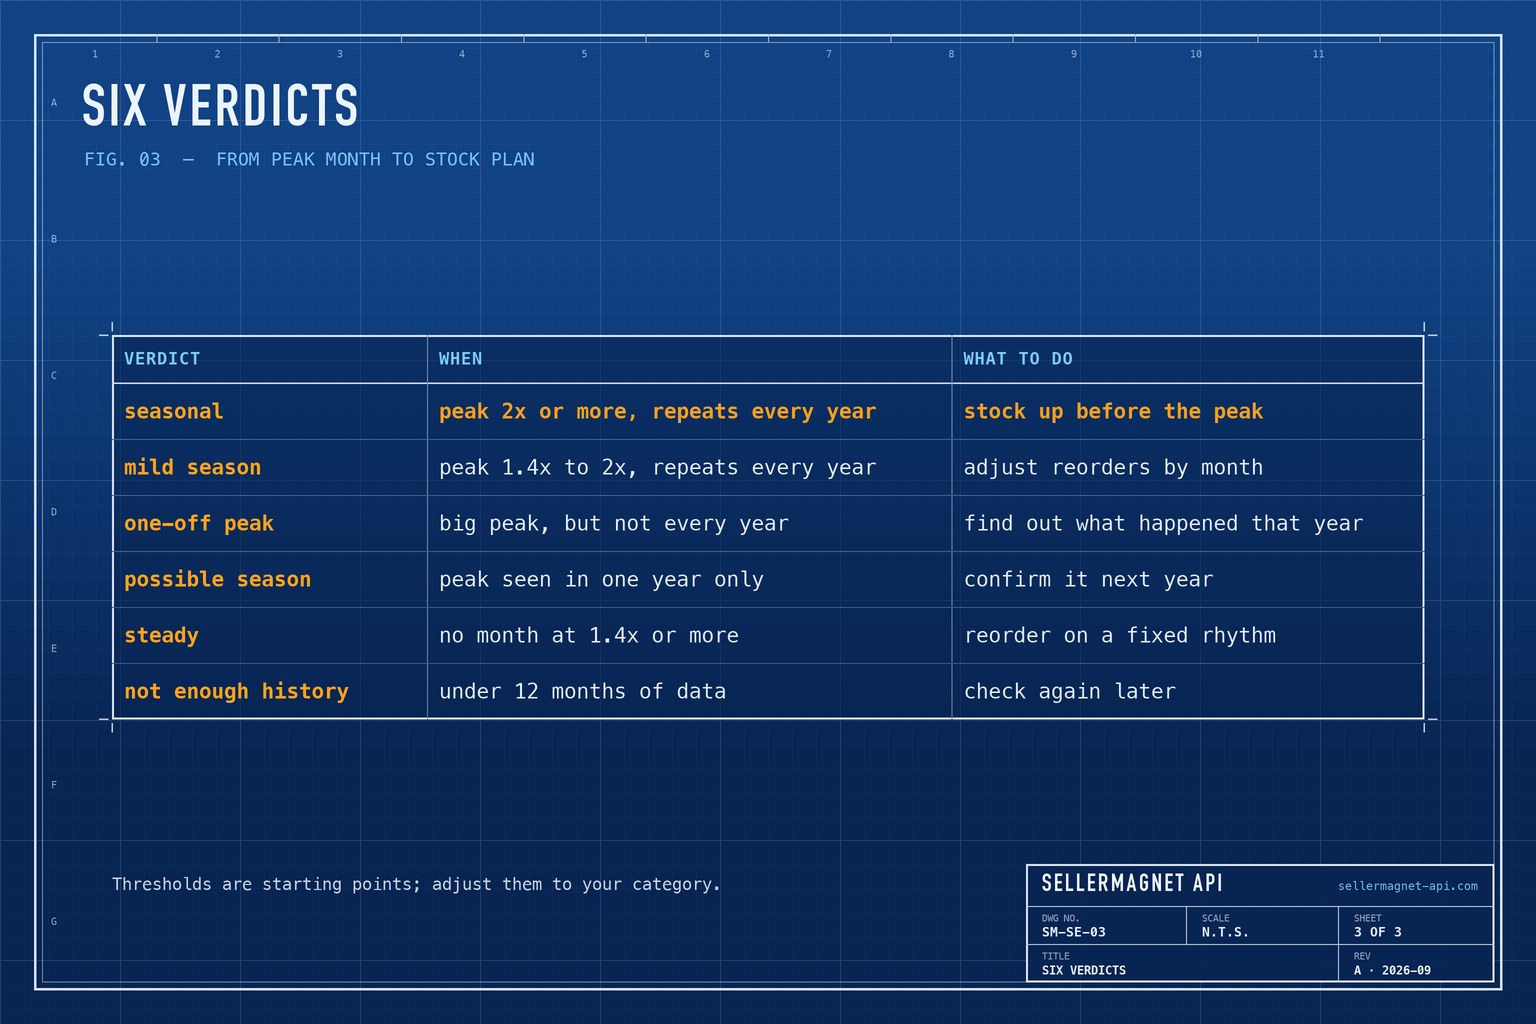
How much lower a product's rank number is in each calendar month than it usually is. For every day, "usually" is the median rank of the 365 days around it; the day's value is that median divided by the day's rank. The script takes the median per month in each year, then the median across years. An index of 3.7 in November means the rank number was about a quarter of the usual one - a rank ratio, not a sales ratio. The peak month decides the verdict, and it must beat the usual rank (1.2 or more) in every year on record.
| Verdict | When | What to do |
|---|---|---|
| Seasonal | Peak 2x or more, repeats every year | Stock up before the peak |
| Mild season | Peak 1.4x to 2x, repeats every year | Adjust reorders by month |
| One-off peak | Big peak, but not every year | Find out what happened that year |
| Possible season | Peak seen in one year only | Confirm it next year |
| Steady | No month at 1.4x or more | Reorder on a fixed rhythm |
| Not enough history | Under 12 months of data | Check again later |
How do I find seasonal Amazon products in Python?
daily_ranks() turns the irregular readings into one rank per day: a reading holds until the next one, at most 14 days, and a -1 (no rank) ends it. season() compares each day with the 365 days around it, builds the index per month and year, and applies the verdicts; it also reports the best month of Amazon's sold badge in the last twelve months. get_with_retry() comes from retry.py, new_session() and ApiError from sellermagnet.py in the Python quickstart.
season.py - seasonal index per calendar month for a list of ASINs
"""Seasonality per ASIN: which calendar months sell best, from the recorded sales rank and Amazon's sold badge."""
import bisect
import csv
import statistics
import threading
from collections import defaultdict
from concurrent.futures import ThreadPoolExecutor
from datetime import date, datetime, timedelta

import requests

from retry import get_with_retry
from sellermagnet import ApiError, new_session

MARKETPLACE = "ATVPDKIKX0DER"                   # statistics covers 11 marketplaces
ASINS = ["B0CL61F39H"]
FILL_DAYS = 14                                  # a reading holds until the next one, at most this long
WINDOW = 182                                    # days either side that define a day's typical rank
MONTHS = "Jan Feb Mar Apr May Jun Jul Aug Sep Oct Nov Dec".split()
_local = threading.local()


def session():
    if not hasattr(_local, "session"):
        _local.session = new_session()
    return _local.session


def daily_ranks(history) -> dict:
    """[[timestamp, rank], ...] -> {day: rank}; -1 (unranked) ends a stretch, the last reading of a day wins."""
    points = [(datetime.strptime(t, "%Y-%m-%d %H:%M:%S").date(), r) for t, r in sorted(history or [])]
    days = {}
    for (day, rank), (next_day, _r) in zip(points, points[1:] + [(date.today() + timedelta(days=1), None)]):
        if not isinstance(rank, int) or rank <= 0:
            continue
        for n in range(max((min(next_day, day + timedelta(days=FILL_DAYS)) - day).days, 1)):
            days[day + timedelta(days=n)] = rank
    return days


def season(asin: str) -> dict:
    row = {"asin": asin, "verdict": "", "peak": "", "peak_index": None, "years": 0, "low": "", "badge_month": "",
           "badge": None, **dict.fromkeys(MONTHS)}
    try:
        stats = get_with_retry(session(), "amazon-product-statistics", asin=asin,
                               marketplaceId=MARKETPLACE)["stats"]
    except ApiError as err:
        return {**row, "verdict": f"error {err.status}"}
    except requests.RequestException as err:
        return {**row, "verdict": type(err).__name__}
    since = f"{date.today().year - 1}-{date.today().month:02d}"
    recent = [(m, u) for m, u in stats.get("monthlySoldHistory") or [] if m >= since]
    if recent:                                             # Amazon's "bought in past month", last 12 months
        row["badge_month"], row["badge"] = max(recent, key=lambda x: x[1])
    ranks = daily_ranks(stats.get("salesRankHistory"))
    days = sorted(ranks)
    per_year = defaultdict(list)                           # (year, month) -> [typical / rank, ...]
    for i, day in enumerate(days):
        lo = bisect.bisect_left(days, day - timedelta(days=WINDOW))
        hi = bisect.bisect_right(days, day + timedelta(days=WINDOW))
        if hi - lo >= 180:                                 # the surrounding year sets "typical": no trend
            typical = statistics.median(ranks[d] for d in days[lo:hi])
            per_year[(day.year, day.month)].append(typical / ranks[day])
    by_month = defaultdict(dict)                           # month -> {year: index}
    for (year, month), ratios in per_year.items():
        if len(ratios) >= 20:                              # at least 20 ranked days in that month
            by_month[month][year] = statistics.median(ratios)
    if len(by_month) < 12:
        return {**row, "verdict": f"not enough history ({len(by_month)} of 12 months)"}
    index = {m: statistics.median(years.values()) for m, years in by_month.items()}
    order = sorted(index, key=index.get, reverse=True)
    peak, years = order[0], by_month[order[0]]
    if index[peak] < 1.4:
        verdict = "steady"
    elif len(years) < 2:
        verdict = "possible season (1 year)"
    elif min(years.values()) < 1.2:
        verdict = "one-off peak"                           # the peak month did not beat typical every year
    else:
        verdict = "seasonal" if index[peak] >= 2 else "mild season"
    return {**row, "verdict": verdict, "peak": " ".join(MONTHS[m - 1] for m in order[:2]),
            "peak_index": round(index[peak], 1), "years": len(years), "low": MONTHS[order[-1] - 1],
            **{MONTHS[m - 1]: round(v, 2) for m, v in index.items()}}


if __name__ == "__main__":
    with ThreadPoolExecutor(max_workers=4) as pool:
        rows = list(pool.map(season, ASINS))
    with open("seasonality.csv", "w", newline="", encoding="utf-8") as fh:
        writer = csv.DictWriter(fh, fieldnames=list(rows[0]))
        writer.writeheader()
        writer.writerows(rows)
    for r in rows:
        detail = f"peak {r['peak']} ({r['peak_index']}x, {r['years']} yr)  low {r['low']}" if r["peak"] else ""
        badge = f"  badge {r['badge']}+ in {r['badge_month']}" if r["badge"] else ""
        print(f"{r['asin']}  {r['verdict']:<12} {detail}{badge}".rstrip())
Output for seven ASINs (illustrative data: one climbing, one with a single deal, one unknown)
B0CL61F39H  seasonal     peak Nov Dec (3.7x, 3 yr)  low Mar  badge 10000+ in 2025-11
B0EXAMPLE1  seasonal     peak Jul Jun (4.0x, 3 yr)  low Feb
B0EXAMPLE2  steady       peak Oct Feb (1.1x, 3 yr)  low Mar
B0EXAMPLE3  steady       peak May Jul (1.0x, 3 yr)  low Oct
B0EXAMPLE4  one-off peak peak Nov Jul (3.8x, 2 yr)  low May
B0EXAMPLE5  possible season (1 year) peak Nov Dec (3.8x, 1 yr)  low Jan
B0EXAMPLE6  error 404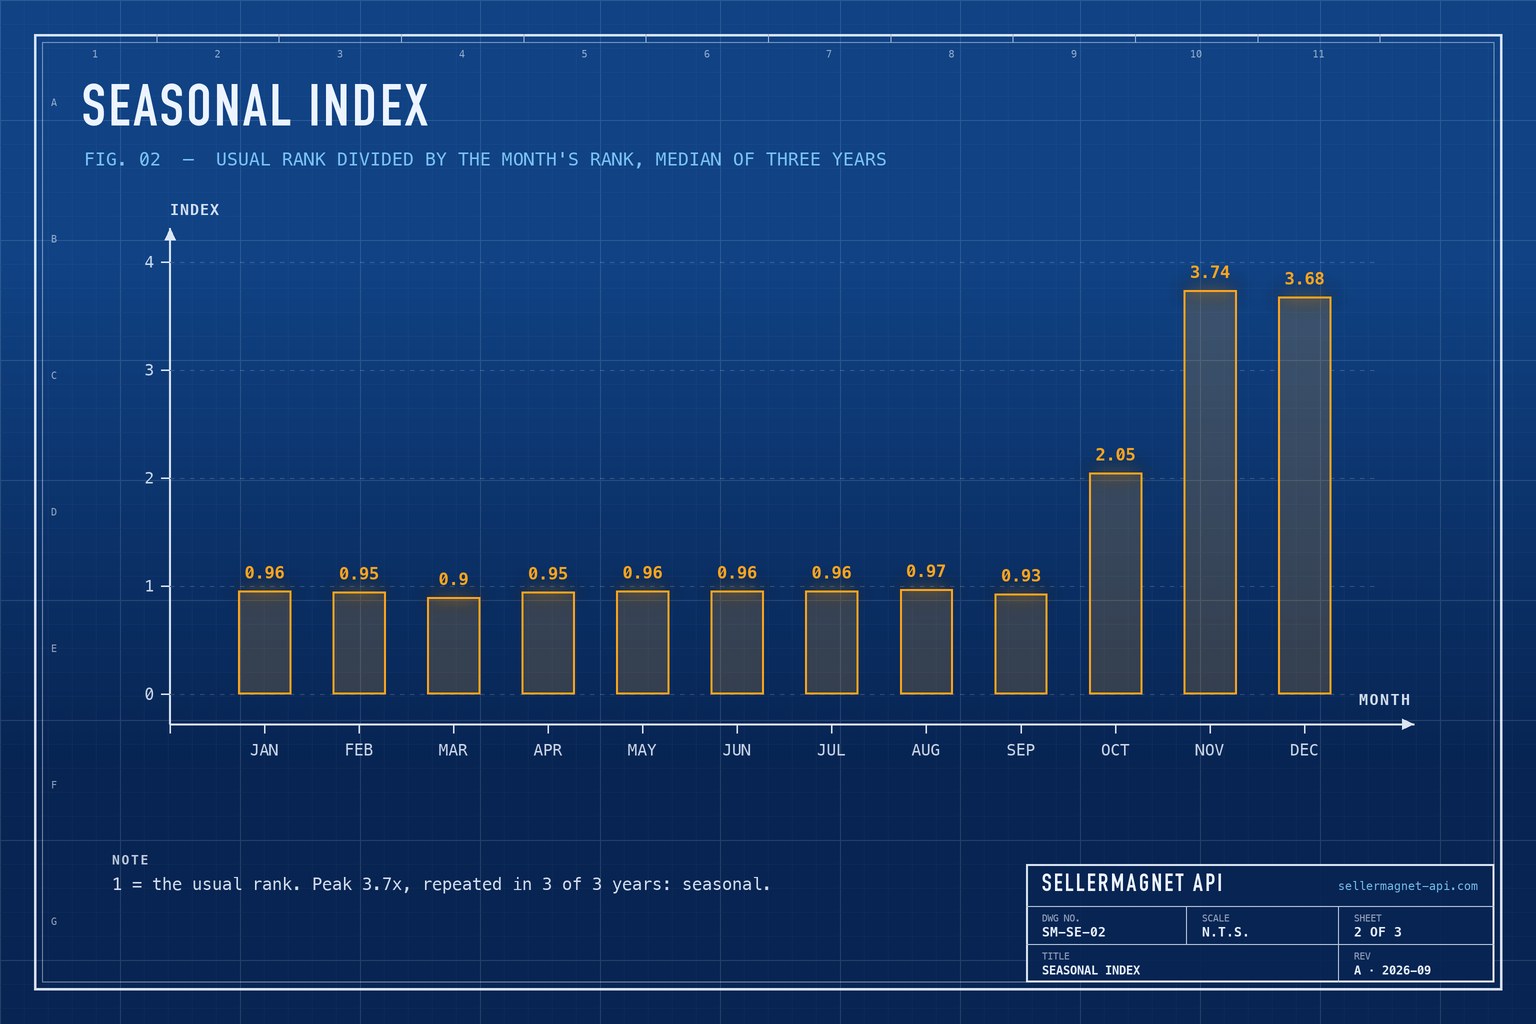
Why can rank stay flat while sales rise?
Because sales rank compares a product with the rest of its category. When a whole category sells more in December, a product that grows with it keeps a similar rank, and the index reads steady. The badge fills part of that gap: monthlySoldHistory records Amazon's own "bought in past month" value - a lower bound such as 10000+, not an estimate - but most products do not carry it. For units, the sales estimator guide covers the estimate endpoint.
The two series the script reads (trimmed, illustrative values)
{
  "success": true,
  "data": {
    "asin": "B0CL61F39H",
    "trackingSince": "2023-09-01",
    "stats": {
      "salesRankHistory": [["2025-11-02 06:14:00", 452], ["2025-11-02 19:40:00", 431],
                           ["2025-11-04 08:05:00", -1], ["2025-11-05 11:30:00", 470]],
      "monthlySoldHistory": [["2025-10", 5000], ["2025-11", 10000], ["2025-12", 10000]]
    }
  }
}
Planning Q4 stock from the index
- Count back from the first strong month. Take the first month at 1.5 or above and subtract your lead time - production, shipping and check-in. With October at 2.0 and a ten-week lead time, order by late July.
- Read the climb, not only the peak. An index of 2 in October on a Q4 product means demand starts before November; stock planned for November arrives after the climb has begun.
- Run stock down into the low month. The weakest month is when to sell through, not when to reorder.
- Look at the years behind a one-off. The script only says a peak did not repeat; the sales rank history guide shows the raw series for that year.
The same function works on a whole category: run season() over the ASINs of a bestseller list from the category bestsellers guide to see which products in a niche peak when - one credit per product.
Frequently Asked Questions
How do I find out if an Amazon product is seasonal?
Compare its median sales rank in each calendar month with its usual rank around that time. If one month's rank number is typically at most half the usual one and that month beats the usual rank every year, treat the product as seasonal.
How much history does the analysis need?
Twelve calendar months with at least 20 ranked days each, and two years before a peak counts as repeated. A product listed this spring cannot show a Q4 pattern yet; the script says so instead of guessing.
Why use rank instead of sales numbers?
Rank history goes back to when tracking of the product began. Amazon's bought-past-month badge is a lower bound such as 10000+ and missing on most products, so the script uses it as a check.
How many credits does it cost?
One per ASIN - a single statistics call returns the whole history. A 200-product catalogue costs 200 credits per run, plus one for each 502 or 503 that get_with_retry() retries.
Which marketplaces are covered?
Statistics covers US, UK, DE, FR, IT, ES, JP, CA, IN, MX and BR. Other marketplace IDs get a free 400.
Bottom line: one statistics call per ASIN turns years of sales rank into twelve numbers that say when a product sells - and when stock has to be there. A free account includes 150 credits, enough to check 150 products before your next peak.


