
To put Amazon product data into Excel, call /api/amazon-product-statistics for the buyBoxPriceHistory series, write one formatted sheet per ASIN with openpyxl, and add a native openpyxl.chart.LineChart built from the same cells the reader sees. The series only records a point when the Buy Box price actually changed, so a day with no entry is a gap, not a price of zero; the code below keeps it out of both the sheet and the chart.
Key Takeaways
- openpyxl is a third-party package (
pip install openpyxl), not part of the Python standard library and not bundled withrequests. - buyBoxPriceHistory only has a point when somebody held the Buy Box: a missing date is a gap, never a zero price (Amazon's own history series drops no-offer periods before the response is returned).
- Prices are integer minor units (cents): divide by 100 for USD/EUR/BRL-style currencies.
- Dedupe ASIN input and validate the 10-character ASIN pattern before paying for a call.
- openpyxl's own
LineChartreads live from worksheet cells, so the chart and the sheet can never disagree the way an image export can.
What does openpyxl need that requests doesn't already provide?
requests and the quickstart's sellermagnet.py / retry.py (from the Python quickstart) handle the API call unchanged. openpyxl is the one new dependency: it writes real .xlsx files, including number formats, frozen header rows and native charts, with no spreadsheet application involved. It is a separate PyPI package, so import openpyxl fails on a plain Python install until it is added.
Install openpyxl next to requests
python3 -m venv .venv
.venv/bin/pip install openpyxl requests
export SELLERMAGNET_API_KEY="your-key-here"
How do I write one Excel sheet per ASIN?
export() validates and dedupes the ASIN list before spending a credit on any of them, then calls amazon-product-lookup once for the title and amazon-product-statistics once for buyBoxPriceHistory. sheet_for_asin() writes a title row, a frozen header, one row per recorded price (converted from cents), and counts the gap days between consecutive recorded dates without ever writing a row for them. get_with_retry() is the quickstart's retry policy: it already stops after one refunded 500, caps billed 5xx retries, and never retries a billed 404.
export_excel.py - price history to a formatted .xlsx workbook
"""Export Amazon Buy Box price history to a formatted Excel workbook (openpyxl), one sheet per ASIN.

Reuses the quickstart's sellermagnet.py / retry.py unchanged. openpyxl is a third-party package
(pip install openpyxl) -- it is NOT part of the Python standard library and ships with neither the
interpreter nor requests.
"""
import sys
from datetime import date

import requests
from openpyxl import Workbook
from openpyxl.chart import LineChart, Reference
from openpyxl.styles import Font
from openpyxl.utils import get_column_letter

from retry import get_with_retry
from sellermagnet import ApiError, new_session

MARKETPLACE_ID = "ATVPDKIKX0DER"            # amazon.com; divide-by-100 below is USD-specific
ASIN_RE = __import__("re").compile(r"^[A-Z0-9]{10}$")
STOP = (401, 403, 503)                      # bad key, no credits, marketplace circuit breaker: stop
MAX_ROWS = 2000                             # cap a single run even if a history series is huge


def to_major(cents: int) -> float:
    """/amazon-product-statistics prices are integers in minor units; USD/EUR/BRL etc. have 2, so /100.

    JPY has no minor unit (prices are already whole yen) - this helper assumes a 2-decimal currency and
    must not be reused unmodified for a yen-priced ASIN.
    """
    return round(cents / 100, 2)


def sheet_for_asin(wb: Workbook, asin: str, title: str, history: list) -> int:
    """Write one sheet: Date | Buy Box price (landed). Returns the number of GAP days noted.

    buyBoxPriceHistory only contains a point when somebody held the Buy Box (no-offer periods are
    dropped before the response is returned, so the series has gaps rather than zeros) -- a missing
    date is a gap, never a zero price, and must not be plotted as 0.
    """
    ws = wb.create_sheet(title=asin)
    ws["A1"] = f"{asin} - {title[:80]}"
    ws["A1"].font = Font(bold=True, size=12)
    ws.merge_cells("A1:B1")
    ws.append([])
    ws.append(["Date", "Buy Box price (landed)"])
    for cell in ws[3]:
        cell.font = Font(bold=True)
    ws.freeze_panes = "A4"

    if not history:
        ws["A5"] = "No recorded Buy Box price history for this ASIN (nobody held the Buy Box yet)."
        return 0

    rows = sorted(history, key=lambda p: p[0])[:MAX_ROWS]
    gap_days = 0
    prev_day = None
    for ts, cents in rows:
        day = ts[:10]
        if prev_day is not None:
            delta = (date.fromisoformat(day) - date.fromisoformat(prev_day)).days
            if delta > 1:
                gap_days += delta - 1
        prev_day = day
        row = [day, to_major(cents)]
        ws.append(row)
        ws.cell(row=ws.max_row, column=2).number_format = "#,##0.00"

    for col in ("A", "B"):
        width = max(len(str(c.value)) for c in ws[col] if c.value is not None)
        ws.column_dimensions[col].width = max(10, width + 2)

    if len(rows) >= 2:
        chart = LineChart()
        chart.title = f"{asin} buy box price"
        chart.y_axis.title = "price"
        chart.x_axis.title = "date"
        last_row = 3 + len(rows)
        data_ref = Reference(ws, min_col=2, min_row=3, max_row=last_row)
        cats_ref = Reference(ws, min_col=1, min_row=4, max_row=last_row)
        chart.add_data(data_ref, titles_from_data=True)
        chart.set_categories(cats_ref)
        ws.add_chart(chart, f"{get_column_letter(4)}3")
    return gap_days


def export(asins: list[str], out_path: str) -> dict:
    """Returns {asin: gap_days} for every ASIN actually written (skips bad/duplicate input, never pays for them)."""
    session = new_session()
    wb = Workbook()
    wb.remove(wb.active)                    # drop the default empty sheet
    seen, result = set(), {}
    for raw in asins:
        asin = raw.strip().upper()
        if asin in seen:
            print(f"{raw}  skipped: duplicate input, not billed again")
            continue
        if not ASIN_RE.fullmatch(asin):
            print(f"{raw}  skipped: not a 10-character ASIN, no credit spent")
            continue
        seen.add(asin)
        try:
            info = get_with_retry(session, "amazon-product-lookup", asin=asin, marketplaceId=MARKETPLACE_ID)
            title = info["productInfo"]["title"]
            stats = get_with_retry(session, "amazon-product-statistics", asin=asin, marketplaceId=MARKETPLACE_ID)
            history = stats.get("buyBoxPriceHistory") or []
            gap_days = sheet_for_asin(wb, asin, title, history)
            result[asin] = gap_days
            print(f"{asin}  {len(history)} point(s), {gap_days} gap day(s)")
        except ApiError as err:
            print(f"{asin}  error {err.status}: {err}")
            if err.status in STOP:
                break
        except requests.RequestException as err:
            print(f"{asin}  network error: {type(err).__name__}")
    if wb.sheetnames:
        wb.save(out_path)
        print(f"saved {out_path} ({len(wb.sheetnames)} sheet(s))")
    else:
        print("nothing to save: no ASIN produced a sheet")
    return result


if __name__ == "__main__":
export(sys.argv[1:] or ["B0CL61F39H", "B0EXAMPLE2"], "price_history.xlsx")| Column | Source | Rule |
|---|---|---|
| Date column | first entry per recorded point | the day a price actually changed |
| Price column | minor units / 100 | USD/EUR/BRL etc.; verify the divisor for other currencies |
| Missing dates | left out of the sheet entirely | never written as a 0 or blank row |
| Chart series | same rows as the sheet | a gap in the sheet is a gap in the line, not a dip to zero |
python export_excel.py B0CL61F39H B0CL61F39H - example output
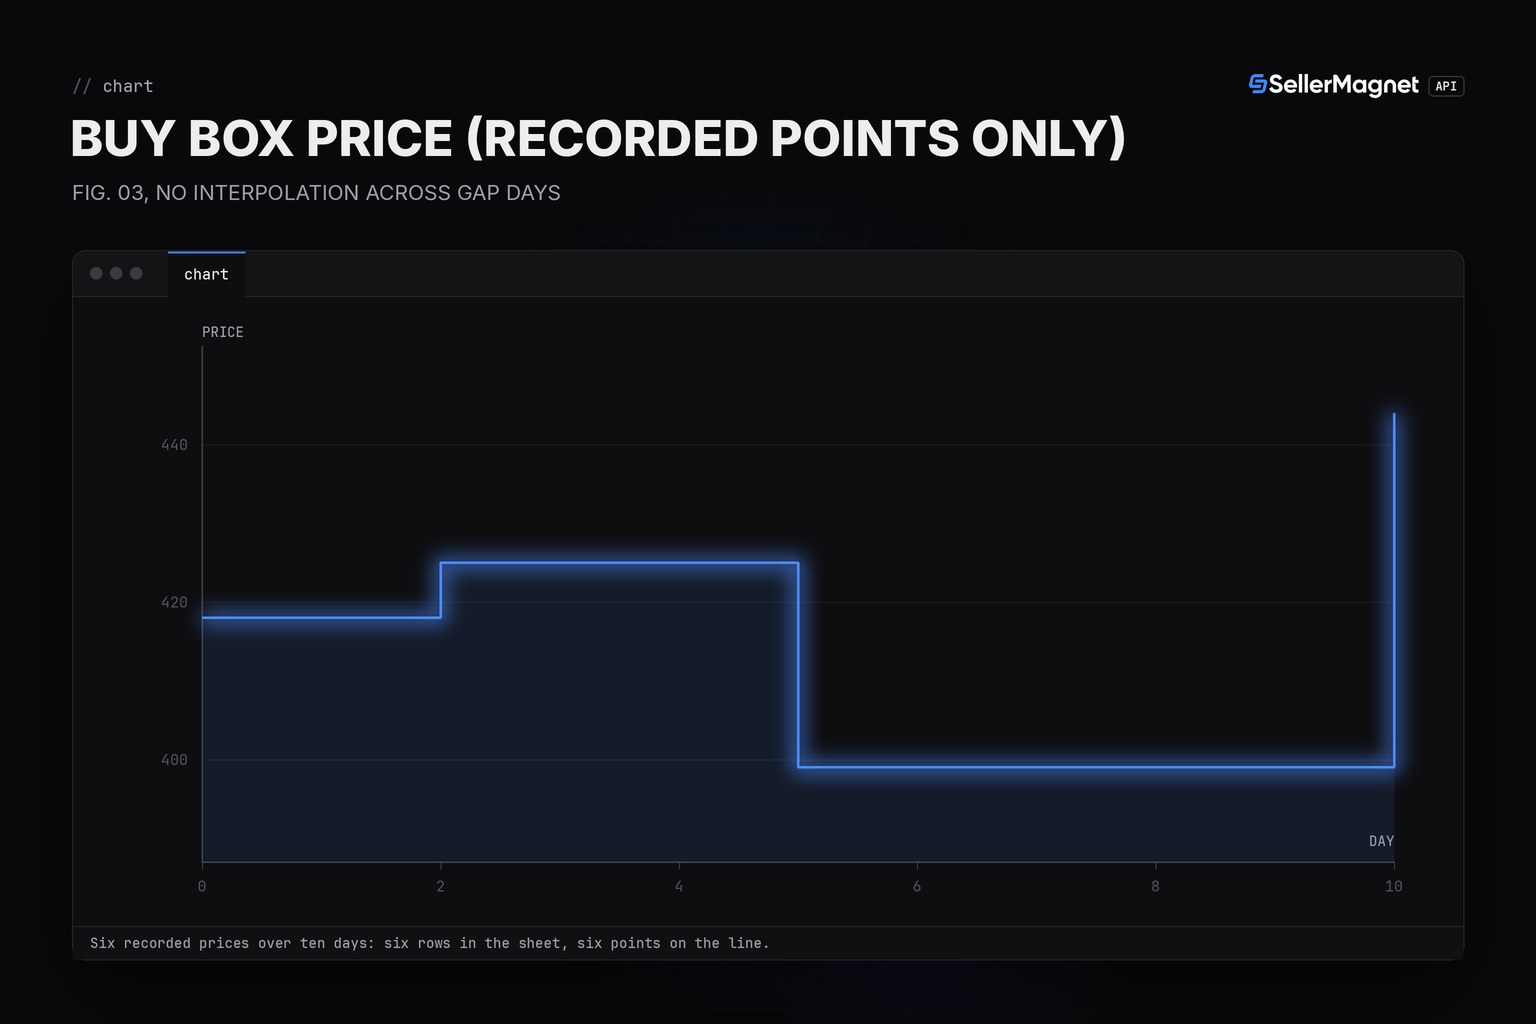
B0CL61F39H  6 point(s), 5 gap day(s)
B0CL61F39H  skipped: duplicate input, not billed again
saved price_history.xlsx (1 sheet(s))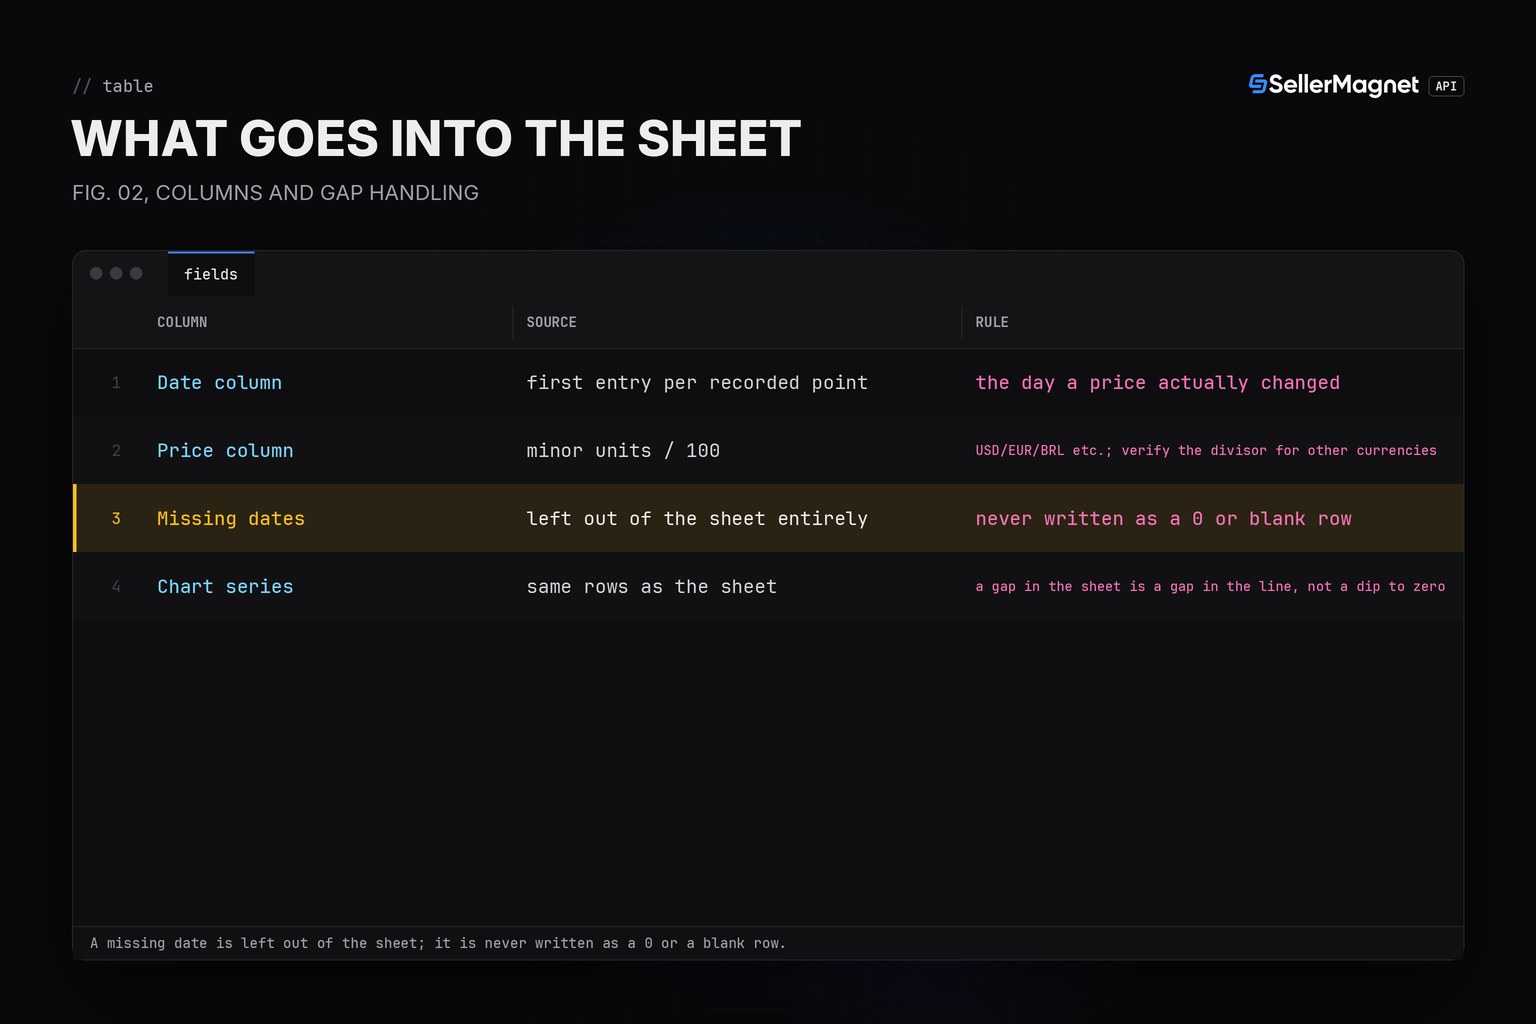
Why build the chart from cells instead of exporting an image?
openpyxl.chart.LineChart with Reference ranges points the chart straight at the worksheet cells. Anyone who opens the file can change a price and watch the chart move, or copy the sheet into another workbook and keep the chart working. The graphs=true PNG that the statistics endpoint can also return is a static image with no such link back to the data; it is useful for a quick preview, not for a workbook someone keeps editing. The chart is only added when there are at least two points, so a one-point or empty series never produces a broken chart object.
One workbook, many ASINs
export() takes a list of ASINs and writes one sheet per unique, valid ASIN into the same workbook, so a weekly run can produce a single file to email or drop in a shared folder. Each ASIN costs its own credits (one call for the title, one for the price history), and a duplicate or invalid ASIN is skipped before either call runs. A run that hits a 401, a 403, or a 503 that is still failing after the quickstart's own retry cap stops the whole batch immediately and saves whatever sheets were already built, rather than losing it over one dead key or outage.
Frequently Asked Questions
Do I need Excel installed to run this?
No. openpyxl writes the .xlsx file format directly; only opening the result needs Excel, LibreOffice or Google Sheets.
Why is a day missing from my price column?
buyBoxPriceHistory only records a point when the price changed or someone newly held the Buy Box. A missing day means no recorded change, not a price of zero.
How do I convert the prices to dollars or euros?
Statistics prices are integer minor units: divide by 100 for USD, EUR, BRL and similar currencies, as the code's to_major() does.
Can I add more ASINs to the same workbook later?
Load the existing file with openpyxl.load_workbook() and call sheet_for_asin() on it before saving again; export() itself always starts a fresh workbook.
Why does a one-point ASIN have no chart?
openpyxl.chart.LineChart needs at least two points to draw a line; the code skips the chart for a single point or empty history rather than add a broken one.
Bottom line: one statistics call per ASIN, a sheet that only ever writes recorded days, and a chart wired to those same cells turn Amazon price history into an .xlsx file a non-technical teammate can open directly. For analysis inside Python instead of a spreadsheet, see the pandas guide; for storing the history long-term, the database guide. The product statistics page has the parameters, and a free account includes 150 credits.


