
To estimate the market size of an Amazon niche, read the category's top 50 with /api/amazon-bestsellers, get each product's estimated monthly units from /api/amazon-product-search-estimated-sells, and multiply by its price. The sum is the monthly revenue of the list; the share held by the top three products and the HHI show whether a few listings dominate it. One category costs about 51 credits. It undercounts the category: it covers the top 50, not the long tail.
Key Takeaways
- One bestsellers call returns the top 50 with prices; one estimate per product adds monthly units - 51 credits.
- Revenue is estimated units times the price shown on the bestseller list, so read it as an order of magnitude.
- Top-3 share and HHI measure concentration; a large niche owned by three listings is harder to enter than a smaller, spread-out one.
- Sales estimates cover 11 marketplaces; check the marketplace first, because elsewhere every estimate returns a free 400.
- The top 50 undercounts the category: the long tail below rank 50 is not counted.
How do I estimate the market size of an Amazon niche?
Pick the category ID that matches the niche - the category ID guide shows how - and run the script. It estimates the 50 products on five threads - each ASIN once - skips any product without a price or estimate, and reports how many it counted, so a gap in the data is visible instead of silently shrinking the total. How the estimate itself is built is explained in the sales estimator guide. get(), new_session() and ApiError come from the Python quickstart.
market_size.py - revenue and concentration of a bestseller list
"""Estimated monthly revenue of a bestseller list, and how concentrated it is."""
import threading
from concurrent.futures import ThreadPoolExecutor

import requests

from sellermagnet import ApiError, get, new_session

HISTORY_MARKETPLACES = {"ATVPDKIKX0DER", "A2EUQ1WTGCTBG2", "A1AM78C64UM0Y8", "A2Q3Y263D00KWC", "A1F83G8C2ARO7P",
                        "A1PA6795UKMFR9", "A13V1IB3VIYZZH", "APJ6JRA9NG5V4", "A1RKKUPIHCS9HS", "A1VC38T7YXB528",
                        "A21TJRUUN4KGV"}   # where sales estimates exist; elsewhere a free 400
_local = threading.local()


def session():
    if not hasattr(_local, "session"):
        _local.session = new_session()
    return _local.session


def units(asin: str, marketplace_id: str) -> int | None:
    try:
        data = get(session(), "amazon-product-search-estimated-sells", asin=asin, marketplaceId=marketplace_id)
    except (ApiError, requests.RequestException):
        return None
    return data.get("estimated_monthly_sales")


def market_size(category_id: str, marketplace_id: str) -> dict:
    if marketplace_id not in HISTORY_MARKETPLACES:
        raise ValueError("Sales estimates are not available for this marketplace.")
    listed = get(session(), "amazon-bestsellers", category_id=category_id, marketplaceId=marketplace_id, count=50)["bestsellers"]
    seen, top = set(), []
    for p in listed:                                   # skip cards without an ASIN, estimate each ASIN once
        if p.get("asin") and p["asin"] not in seen:
            seen.add(p["asin"])
            top.append(p)
    with ThreadPoolExecutor(max_workers=5) as pool:
        estimates = list(pool.map(lambda p: units(p["asin"], marketplace_id), top))
    rows = [{"rank": p.get("rank"), "asin": p["asin"], "units": u, "revenue": round(u * p["price"]["price"], 2)}
            for p, u in zip(top, estimates)
            if isinstance(u, (int, float)) and isinstance((p.get("price") or {}).get("price"), (int, float))]
    total = sum(r["revenue"] for r in rows)
    shares = sorted((r["revenue"] / total for r in rows), reverse=True) if total else []
    top10_reviews = sorted(p.get("reviewAmount") or 0 for p in top[:10])
    return {
        "products_counted": len(rows), "products_listed": len(listed),
        "monthly_units": sum(r["units"] for r in rows),
        "monthly_revenue": round(total, 2),
        "top3_share_pct": round(100 * sum(shares[:3]), 1) if shares else None,
        "hhi": round(sum((100 * s) ** 2 for s in shares)) if shares else None,   # up to 10,000
        "top10_median_reviews": top10_reviews[len(top10_reviews) // 2] if top10_reviews else None,
        "rows": sorted(rows, key=lambda r: -r["revenue"]),
    }


if __name__ == "__main__":
    report = market_size("281407", "ATVPDKIKX0DER")   # Electronics > Accessories & Supplies
    print({k: v for k, v in report.items() if k != "rows"})
    for r in report["rows"][:5]:
        print(r)
Example output (illustrative values)
{'products_counted': 45, 'products_listed': 50, 'monthly_units': 83155,
 'monthly_revenue': 2180887.0, 'top3_share_pct': 20.9, 'hhi': 324, 'top10_median_reviews': 60}
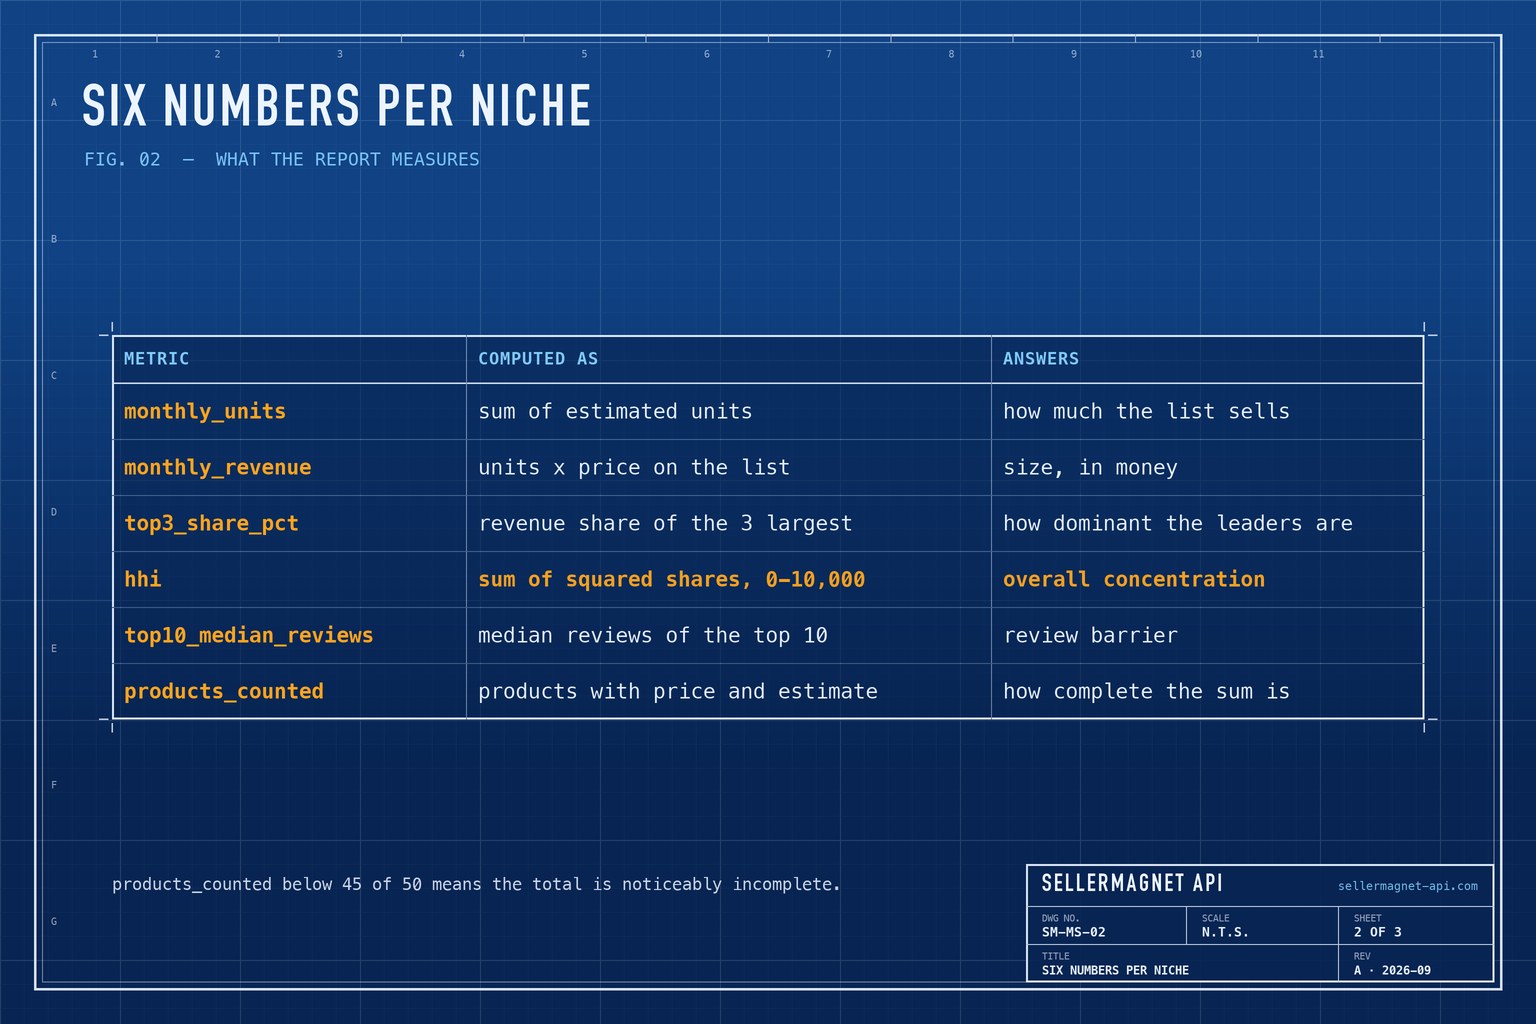
{'rank': 1, 'asin': 'B0CL61F39H', 'units': 20000, 'revenue': 230000.0}| Metric | Computed as | Answers |
|---|---|---|
monthly_units | Sum of estimated units | How much the list sells |
monthly_revenue | Units x price on the list | Size, in money |
top3_share_pct | Revenue share of the 3 largest | How dominant the leaders are |
hhi | Sum of squared shares, 0-10,000 | Overall concentration |
top10_median_reviews | Median reviews of the top 10 | Review barrier |
products_counted | Products with price and estimate | How complete the sum is |
How do I read concentration?
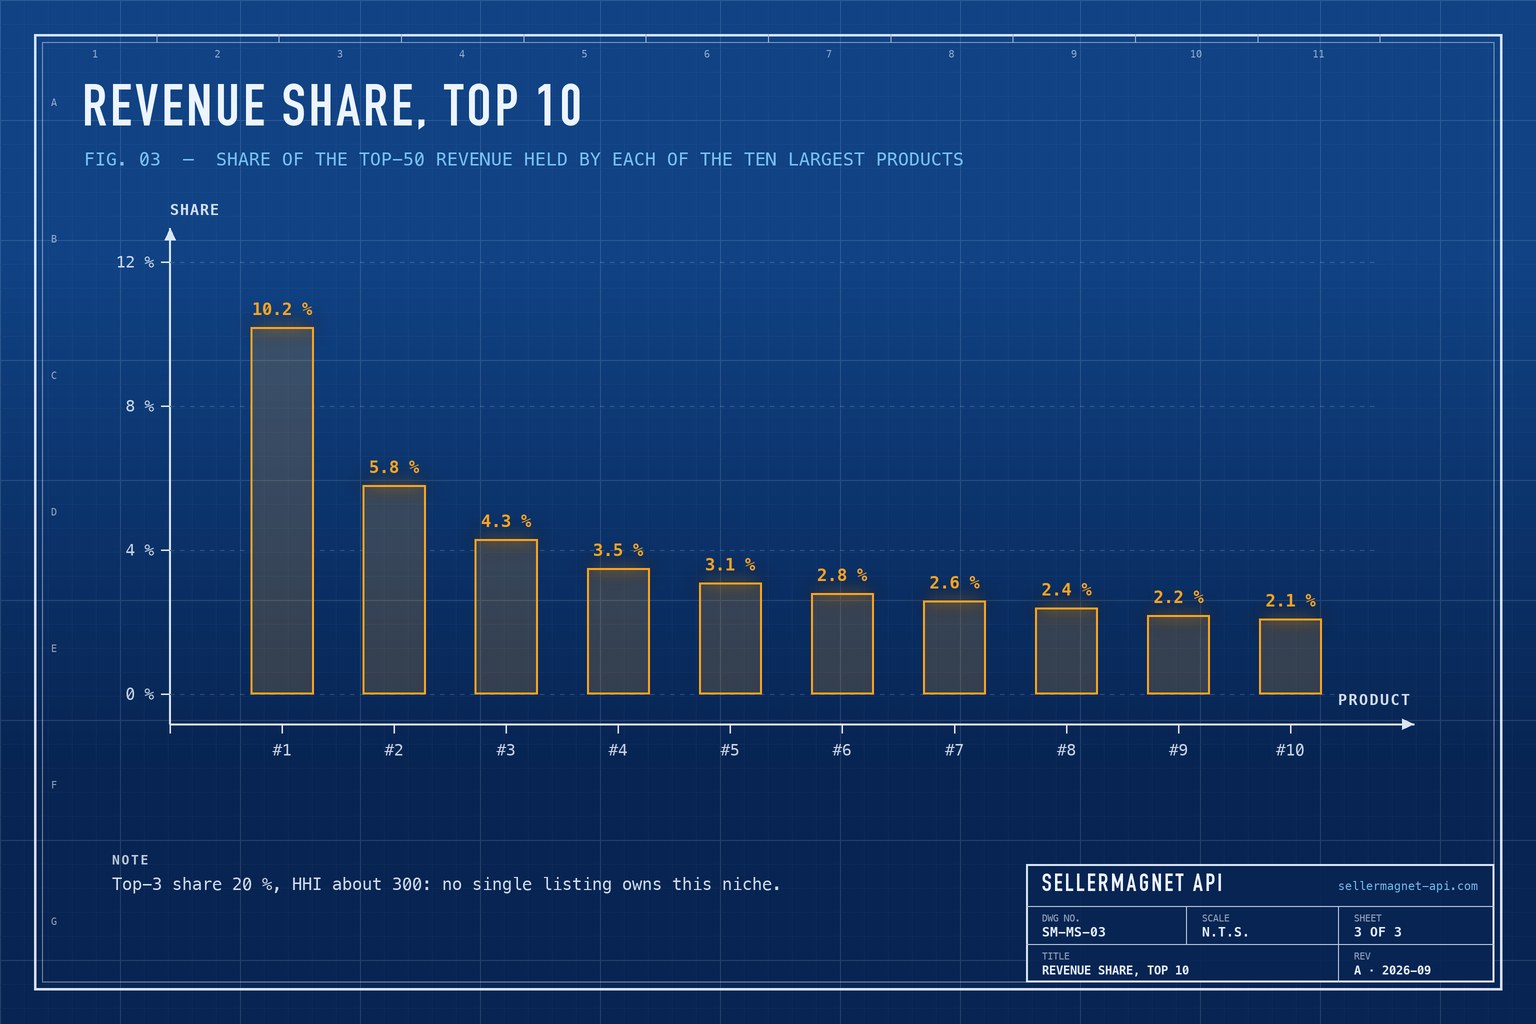
The HHI adds up the squared revenue shares of all products, in percent. Over 50 products it runs from 200 (all equal) to 10,000 (one product takes everything); the floor is 10,000 divided by products_counted. It is measured per listing, not per brand - one brand with ten listings looks spread out - and shares within the top 50 are higher than shares of the whole category. The 2023 US Merger Guidelines treat markets above 1,800 as highly concentrated - a useful reference, not a rule for Amazon niches. In practice: a top-3 share above half the list means three listings take most of the money, and a newcomer competes with them directly; a low HHI with a long, even list leaves room at ranks 10 to 50. top10_median_reviews adds the review barrier from the same list at no extra credit.
How accurate is a market size from 50 products?
Treat it as a range. Each unit figure is an estimate that can be too high or too low, the price is the one shown on the bestseller list today rather than the month's average, and the long tail below rank 50 is missing - in broad categories it can be large. The numbers are most useful for comparing niches measured the same way on the same day, and for tracking one niche month over month; for seasonality, see the sales rank history guide. A product without a price on the list or without an estimate is left out, and products_counted shows how many made it in.
Top 50 with prices from the command line (1 credit)
curl -sG "https://sellermagnet-api.com/api/amazon-bestsellers" \
  -H "X-Api-Key: $SELLERMAGNET_API_KEY" --max-time 120 \
  --data-urlencode "category_id=281407" \
  --data-urlencode "marketplaceId=ATVPDKIKX0DER" \
  --data-urlencode "count=50" \
  | jq -r 'if .success then (.data.bestsellers[] | [.rank, .asin, .price.price] | @tsv)
           else error(.message) end'
Frequently Asked Questions
How can I estimate an Amazon niche's monthly revenue?
Estimate monthly units for each product in the category's top 50, multiply by each price and add them up. It takes one bestsellers call and fifty estimates.
Why does the result undercount the category?
Only the top 50 products are counted. Products below rank 50 also sell, and in broad categories their combined revenue can be substantial.
What is a high HHI for an Amazon niche?
There is no Amazon-specific threshold. The 2023 US Merger Guidelines call markets above 1,800 highly concentrated; use it as a reference point.
Which marketplaces support sales estimates?
The 11 marketplaces with recorded history, including amazon.com, .co.uk, .de, .fr, .it, .es and .co.jp. Other marketplaces return a free 400.
How many credits does one niche cost?
About 51: one for the list and one per estimate. An internal error is refunded; a 404 or a 502/503 is charged, and the script leaves those products out.
Bottom line: 51 credits turn a bestseller list into a monthly revenue estimate and two concentration numbers - enough to compare niches before investing in one. The sales estimate page lists the fields, and a free account includes 150 credits.


