
To track an Amazon product's rating and review count over time, call /api/amazon-product-statistics with the ASIN and marketplace ID. One credit returns the recorded history of both: stats.productRatingHistory holds the star rating and stats.productRatingCountHistory the number of ratings, each as a list of [timestamp, value] pairs. This guide shows the format, the markers to drop, a weekly series in Python and how to flag review drops and sudden jumps.
Key Takeaways
- One statistics call returns the full recorded rating and ratings-count history; no daily polling is needed to backfill.
- Each series is a list of ["YYYY-MM-DD HH:MM:SS", value] pairs in UTC, with a point when the value changed.
- A series can end with -0.1 (rating) or -1 (count) when data stops; drop negative values before any maths.
- productReviewAverage and productTotalReviews already give the latest real values.
- History is available on 11 marketplaces; the others get a free 400 before any credit is charged.
What does the rating history look like?
Both series sit under data.stats. Ratings are stars with one decimal; counts are the global ratings count Amazon shows next to the stars, which includes ratings without a written review and can include ratings from other Amazon stores. Points are irregular - a new one appears when the recorded value changes - so resample before comparing products.
Rating fields from /api/amazon-product-statistics (trimmed, example values)
{
  "success": true,
  "data": {
    "asin": "B0CL61F39H",
    "marketplaceId": "ATVPDKIKX0DER",
    "productReviewAverage": 4.6,
    "productTotalReviews": 3129,
    "stats": {
      "productRatingHistory": [
        ["2025-11-02 14:20:00", 4.7],
        ["2026-03-18 09:02:00", 4.6]
      ],
      "productRatingCountHistory": [
        ["2025-11-02 14:20:00", 2410],
        ["2026-01-09 06:44:00", 2682],
        ["2026-09-20 11:16:00", 3129]
      ]
    }
  }
}| Field | Endpoint | Example | Meaning |
|---|---|---|---|
stats.productRatingHistory | Statistics | [time, 4.6] | Stars, 1 decimal |
stats.productRatingCountHistory | Statistics | [time, 3129] | Ratings count |
productReviewAverage | Statistics | 4.6 | Latest real value |
productTotalReviews | Statistics | 3129 | Latest real value |
reviews.averageRating | Lookup | 4.6 | Live page |
reviews.totalReviews | Lookup | 3129 | Live page |
Drop the end-of-data markers
When the recorded data stops, a series can end with -0.1 for the rating or -1 for the count. Averaging or charting them unfiltered drags the numbers down. Keep only values of zero or more; productReviewAverage and productTotalReviews already do this for the latest value.
How do I build a weekly review series in Python?
Take the last value of each week and carry it forward through weeks without a new point. The difference between consecutive weekly counts is the number of new ratings per week - a useful proxy for demand when read together with the sales rank history. get() and new_session() are the helpers from the Python quickstart.
ratings.py - clean, resample weekly, compute new ratings per week
from datetime import date, datetime, timedelta

from sellermagnet import get, new_session


def clean(series) -> list[tuple[datetime, float]]:
    """Parse [time, value] pairs and drop the -1 / -0.1 end-of-data markers."""
    return [(datetime.strptime(ts, "%Y-%m-%d %H:%M:%S"), value)
            for ts, value in (series or [])
            if isinstance(value, (int, float)) and value >= 0]


def monday(ts: datetime) -> date:
    return (ts - timedelta(days=ts.weekday())).date()


def weekly(points, until: date | None = None) -> dict[date, float]:
    """Last value per ISO week (keyed by Monday), carried forward through empty weeks up to `until`."""
    if not points:
        return {}
    last = {}
    for ts, value in sorted(points):
        last[monday(ts)] = value
    week, end, out, value = min(last), max(max(last), until or min(last)), {}, None
    while week <= end:
        value = last.get(week, value)
        out[week] = value
        week += timedelta(days=7)
    return out


stats = get(new_session(), "amazon-product-statistics", asin="B0CL61F39H", marketplaceId="ATVPDKIKX0DER")["stats"]
count_points = clean(stats["productRatingCountHistory"])
counts = weekly(count_points)
stars = weekly(clean(stats["productRatingHistory"]), until=max(counts, default=None))

# New ratings per week, measured only between weeks that have a real point, so a
# gap in the data is spread over its weeks instead of looking like a jump.
real = sorted({monday(ts) for ts, _ in count_points})
gains = {w: round((counts[w] - counts[p]) / ((w - p).days // 7)) for p, w in zip(real, real[1:])}
weeks = sorted(counts)
for w in weeks[-8:]:
    print(w, stars.get(w), counts[w], gains.get(w, ""))
How do I spot a review drop or a sudden jump?
Two patterns deserve an alert. A drop means ratings stopped counting for this product: Amazon removes reviews it considers invalid, a variation split takes the child's ratings away, and between February and May 2026 Amazon stopped sharing ratings between variations that differ in function. A jump of several times the usual weekly gain often means variations were merged and their ratings pooled, not that sales exploded; only variations with minor differences such as colour, size or pack size still share ratings. Compare each week with the median of recent weeks, with a floor, so the rule scales with the listing.
alerts.py - flag drops and jumps against the recent median
from statistics import median


def review_alerts(gains: dict, window: int = 8, factor: float = 5.0, min_gain: int = 25) -> list[str]:
    alerts, weeks = [], sorted(gains)
    for i, week in enumerate(weeks):
        gain = gains[week]
        recent = [gains[w] for w in weeks[max(0, i - window):i] if gains[w] > 0]
        if gain < 0:
            alerts.append(f"{week}: {-gain} ratings removed")
        elif len(recent) >= 4 and gain >= min_gain and gain > factor * median(recent):
            alerts.append(f"{week}: +{gain} ratings, {gain / median(recent):.0f}x the usual - check for a variation merge")
    return alerts


# with gains from ratings.py:
# for line in review_alerts(gains): print(line)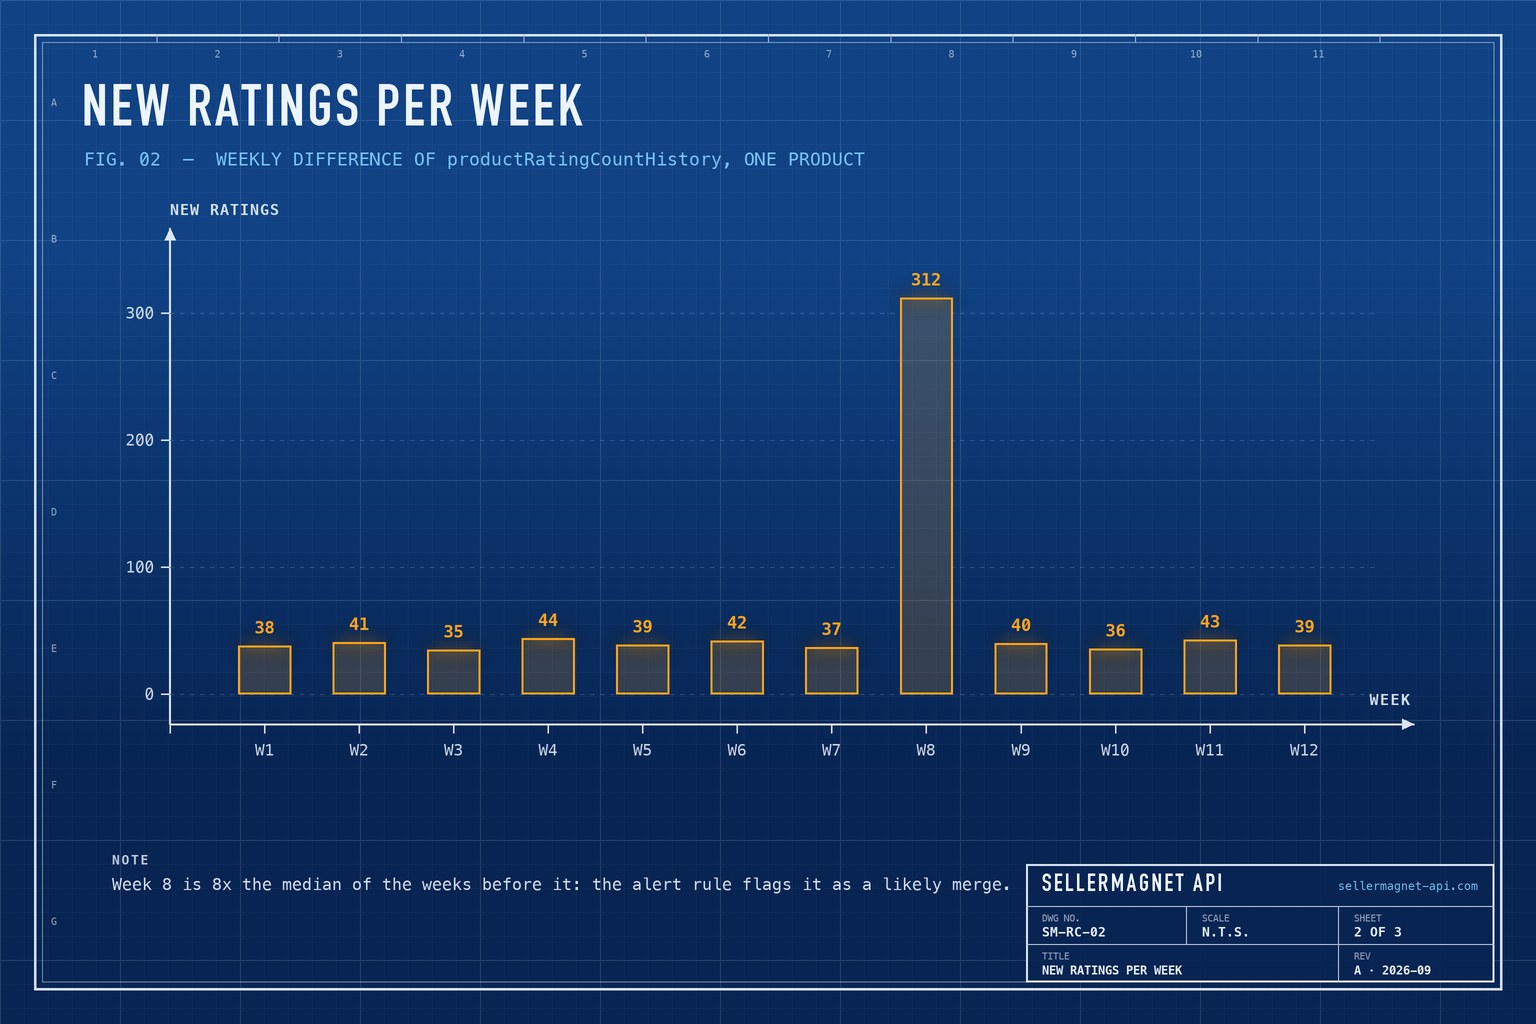
Should I use lookup or statistics for ratings?
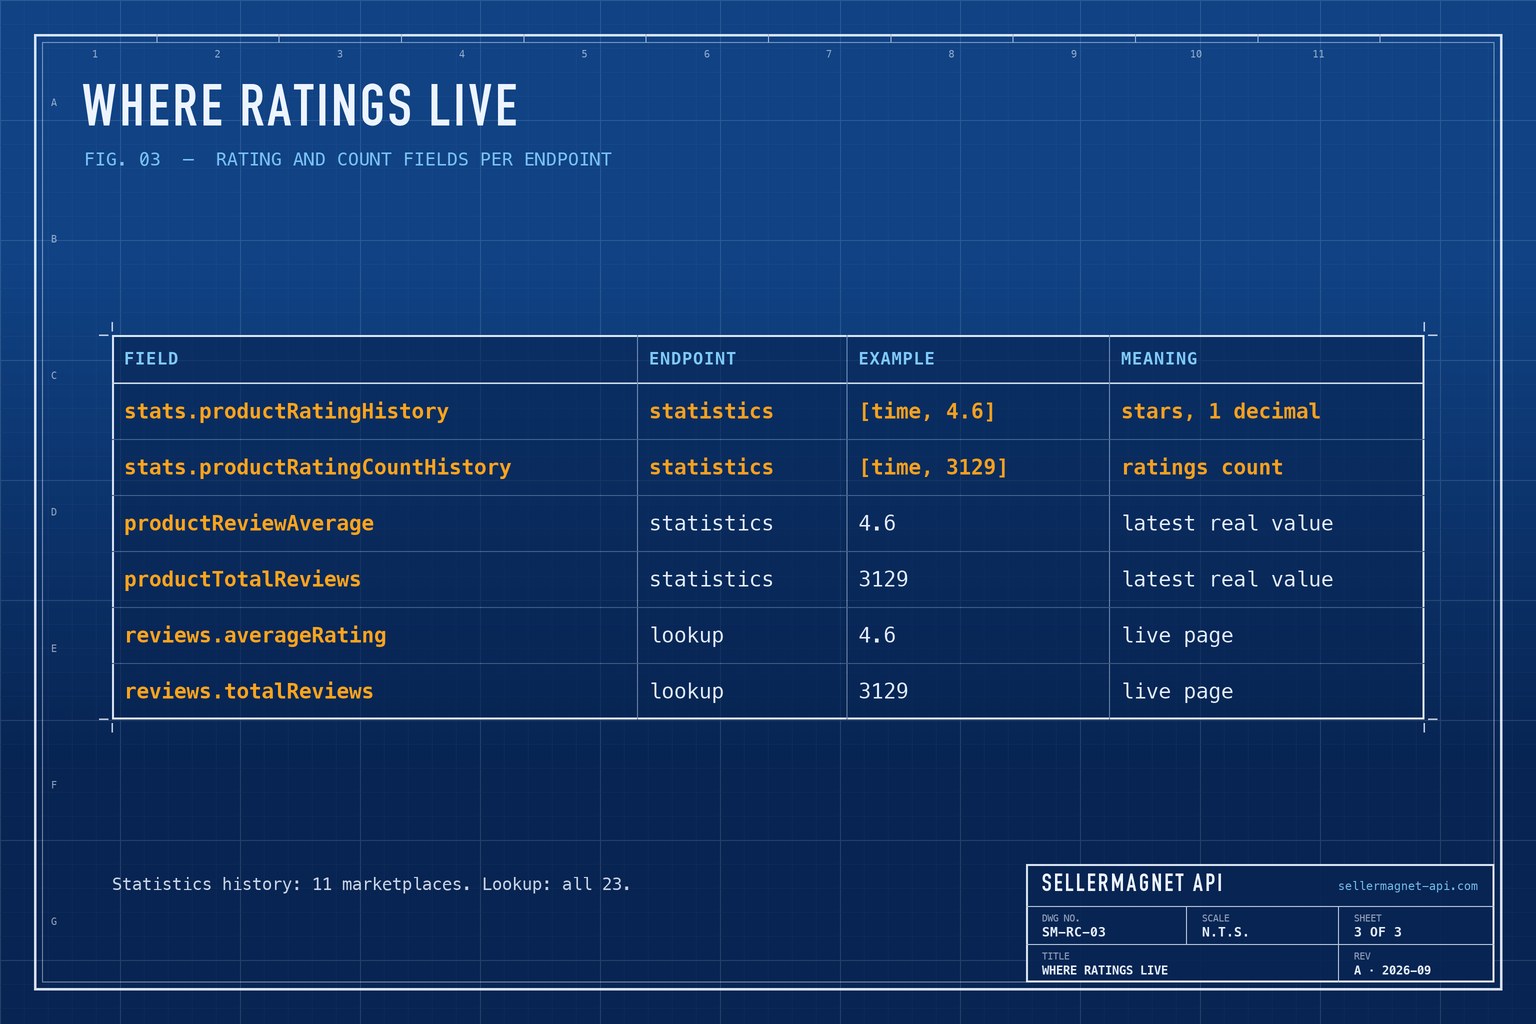
Use statistics for history and for the latest recorded value; use lookup when you need exactly what the product page shows right now. /api/amazon-product-lookup reads the live page and returns reviews.averageRating, reviews.totalReviews and reviews.reviewSummary, the page's text such as "4.6 out of 5 stars" (null and 0 when the page shows no rating). Both cost one credit per call. Lookup works on all 23 marketplaces; the statistics history covers 11.
Can I check the latest count from the command line?
Yes. jq can drop the markers and print the last few points of the count history directly.
Last five real points of the ratings-count history
curl -sG "https://sellermagnet-api.com/api/amazon-product-statistics" \
  -H "X-Api-Key: $SELLERMAGNET_API_KEY" --max-time 120 \
  --data-urlencode "asin=B0CL61F39H" \
  --data-urlencode "marketplaceId=ATVPDKIKX0DER" \
  | jq -r 'if .success then (.data.stats.productRatingCountHistory // [])
           | map(select(.[1] >= 0)) | .[-5:][] | @tsv else error(.message) end'
The same call carries the price and Buy Box history as well; the price history guide covers those series, and the product statistics page has the parameters and code samples. Add graphs=true to get PNG charts of both rating series for the same credit. A malformed ASIN is a billed 400 on this endpoint, so validate it first.
Frequently Asked Questions
How far back does the rating history go?
As far as the recorded history for that product; data.trackingSince shows where it starts. One call returns all of it.
Is the review count the number of written reviews?
No. It is the ratings count Amazon shows next to the stars, which includes ratings without a written review.
Why does the history end with -1?
The value marks that recorded data stopped. Drop negative values; productTotalReviews and productReviewAverage already skip them.
Which marketplaces have rating history?
The 11 marketplaces with recorded history, including amazon.com, .co.uk, .de, .fr, .it, .es, .co.jp and .ca. Others return a free 400.
Can I get individual reviews or the star breakdown?
No. Lookup returns the average, the count and the page's rating summary text, and statistics returns their history - no review texts and no 1-to-5-star split.
Bottom line: one statistics call gives the rating and ratings-count history, a filter removes the end-of-data markers, and weekly differences show review velocity and the jumps worth a look. A free account includes 150 credits to try it.


