
Amazon price elasticity is how strongly sales react to a price change. Without the seller's own sales data, the recorded history is the next best source: /api/amazon-product-statistics returns the Buy Box price and the sales rank history in one call. For every price change of 5 % or more that held for more than a week on both sides, compare the median rank of the week before with the week after. A median gain of 20 % or more over at least three clean cuts marks a price-sensitive product.
Key Takeaways
- One statistics call per ASIN returns both the Buy Box price history and the sales rank history.
- Only clean events count: a change of at least 5 % where the old and the new price each held for more than a week.
- The rank change is (rank before - rank after) / rank before, from the median of the 7 days on each side; positive means a better rank.
- The result is a rank response, not a sales elasticity: how many more units a better rank means depends on the category.
- Deals, competitor stock-outs and seasons move the rank too, so several events in the same direction are the signal, not one.
What does price elasticity mean on Amazon?
How much the sales of a product change when its price changes. Amazon publishes only a rounded "bought in past month" figure, and only for some products; the sales rank - the product's position among its category's best sellers - moves with sales, and its history is recorded next to the Buy Box price. A product whose rank improves sharply after every cut is price-sensitive; one whose rank does not move sells for other reasons. The table shows the verdicts the script gives.
| Verdict | When | What it suggests |
|---|---|---|
| Price-sensitive | 3+ cuts, median rank gain 20 % or more | Price cuts move volume - test them |
| Some reaction | 3+ cuts, median rank gain 5 to 20 % | Cuts help a little - check the margin |
| Cuts barely moved the rank | 3+ cuts, median rank gain under 5 % | Compete on something else |
| Too few clean price cuts | Fewer than 3 cuts that held a week | Wait for more history |
How do I measure the effect of price changes in Python?
price_steps() reduces the Buy Box history to the days the price changed - a landed price, so a change in shipping counts too. daily_ranks() turns the irregular rank readings into one rank per day: a reading counts for its own day and the next, and -1 (no rank) is dropped, so sparse readings leave gaps instead of carrying an old rank into the week after. events() keeps the clean changes and compares the rank windows around each; summary() reports cuts and rises and the verdict. Every event also lands in price_events.csv. get_with_retry() comes from retry.py, new_session() and ApiError from sellermagnet.py in the Python quickstart.
price_impact.py - the rank in the week after each Buy Box price change
"""Price changes and sales rank: how the rank moved in the week after each Buy Box price change."""
import csv
import statistics
from datetime import date, datetime, timedelta

import requests

from retry import get_with_retry
from sellermagnet import ApiError, new_session

MARKETPLACE = "ATVPDKIKX0DER"                   # statistics covers 11 marketplaces
ASINS = ["B0CL61F39H"]
MINOR = 100                                     # history prices are in minor units; 1 on amazon.co.jp
MIN_CHANGE, WEEK, FILL_DAYS = 0.05, 7, 2           # a rank reading counts for its own day and the next


def daily_ranks(history) -> dict:
    """[[timestamp, rank], ...] -> {day: rank}; -1 (unranked) ends a stretch, the last reading of a day wins."""
    points = [(datetime.strptime(t, "%Y-%m-%d %H:%M:%S").date(), r) for t, r in sorted(history or [])]
    days = {}
    for (day, rank), (next_day, _r) in zip(points, points[1:] + [(date.today() + timedelta(days=1), None)]):
        if not isinstance(rank, int) or rank <= 0:
            continue
        for n in range(max((min(next_day, day + timedelta(days=FILL_DAYS)) - day).days, 1)):
            days[day + timedelta(days=n)] = rank
    return days


def price_steps(history) -> list:
    """[["YYYY-MM-DD", minor units], ...] -> [(day, price)] for the days the Buy Box price changed."""
    last = {}
    for day, price in history or []:
        last[date.fromisoformat(day)] = price / MINOR      # several entries a day: the last one wins
    steps = []
    for day in sorted(last):
        if not steps or last[day] != steps[-1][1]:
            steps.append((day, last[day]))
    return steps


def events(asin: str, stats: dict) -> list[dict]:
    steps, ranks = price_steps(stats.get("buyBoxPriceHistory")), daily_ranks(stats.get("salesRankHistory"))
    out = []
    for (d0, p0), (d1, p1), (d2, _p) in zip(steps, steps[1:], steps[2:] + [(date.today(), None)]):
        change = (p1 - p0) / p0 if p0 > 0 else 0
        if abs(change) < MIN_CHANGE or (d1 - d0).days <= WEEK or (d2 - d1).days <= WEEK:
            continue                                     # small, or a price held a week or less
        before = [ranks[d] for d in (d1 - timedelta(days=n) for n in range(1, WEEK + 1)) if d in ranks]
        after = [ranks[d] for d in (d1 + timedelta(days=n) for n in range(1, WEEK + 1)) if d in ranks]
        if len(before) < 4 or len(after) < 4:
            continue                                     # not enough ranked days to compare
        rank_before, rank_after = statistics.median(before), statistics.median(after)
        out.append({"asin": asin, "day": d1.isoformat(), "old": p0, "new": p1, "price_pct": round(change * 100, 1),
                    "rank_before": rank_before, "rank_after": rank_after,
                    "rank_pct": round((rank_before - rank_after) / rank_before * 100, 1)})   # + = better rank
    return out


def summary(found: list[dict]) -> str:
    parts, cuts = [], [e["rank_pct"] for e in found if e["price_pct"] < 0]
    for name, group in (("cuts", [e for e in found if e["price_pct"] < 0]),
                        ("rises", [e for e in found if e["price_pct"] > 0])):
        if group:
            price = statistics.median(e["price_pct"] for e in group)
            rank = statistics.median(e["rank_pct"] for e in group)
            label = name if len(group) > 1 else name[:-1]               # "1 cut", "3 cuts"
            parts.append(f"{len(group)} {label}: price {price:+.1f}% -> rank {rank:+.1f}%")
    if len(cuts) < 3:
        verdict = "too few clean price cuts"
    elif statistics.median(cuts) >= 20:
        verdict = "price-sensitive"
    else:
        verdict = "some reaction" if statistics.median(cuts) >= 5 else "cuts barely moved the rank"
    return "   ".join(parts + [verdict])


if __name__ == "__main__":
    session, rows = new_session(), []
    for asin in ASINS:
        try:
            stats = get_with_retry(session, "amazon-product-statistics", asin=asin,
                                   marketplaceId=MARKETPLACE)["stats"]
        except (ApiError, requests.RequestException) as err:
            print(f"{asin}  skipped: {err}")
            continue
        found = events(asin, stats)
        rows += found
        print(f"{asin}  {summary(found)}")
    with open("price_events.csv", "w", newline="", encoding="utf-8") as fh:
        writer = csv.DictWriter(fh, fieldnames=["asin", "day", "old", "new", "price_pct", "rank_before",
                                                "rank_after", "rank_pct"])
        writer.writeheader()
        writer.writerows(rows)
Output for five ASINs (illustrative data; one unknown ASIN)
B0CL61F39H  7 cuts: price -10.0% -> rank +37.2%   7 rises: price +10.0% -> rank -40.2%   price-sensitive
B0EXAMPLE1  5 cuts: price -15.0% -> rank +0.8%   9 rises: price +10.0% -> rank -1.3%   cuts barely moved the rank
B0EXAMPLE2  too few clean price cuts
B0EXAMPLE3  5 cuts: price -10.0% -> rank +27.6%   4 rises: price +15.0% -> rank -42.3%   price-sensitive
B0EXAMPLE4  skipped: 404: Product not found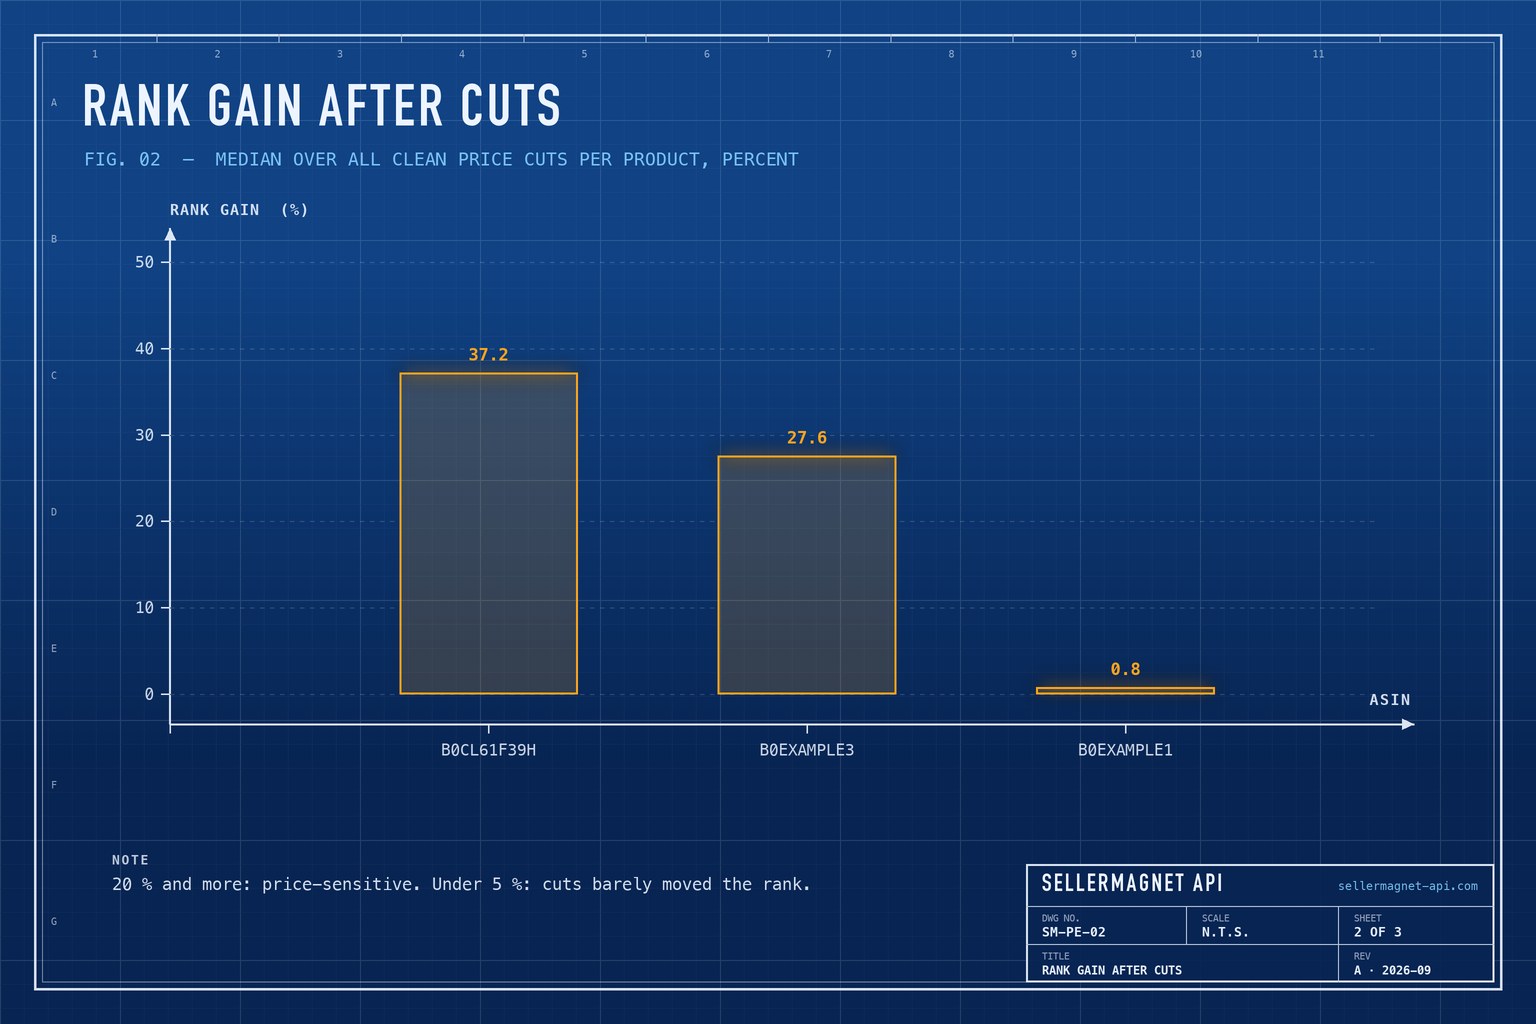
How do I read one price change?
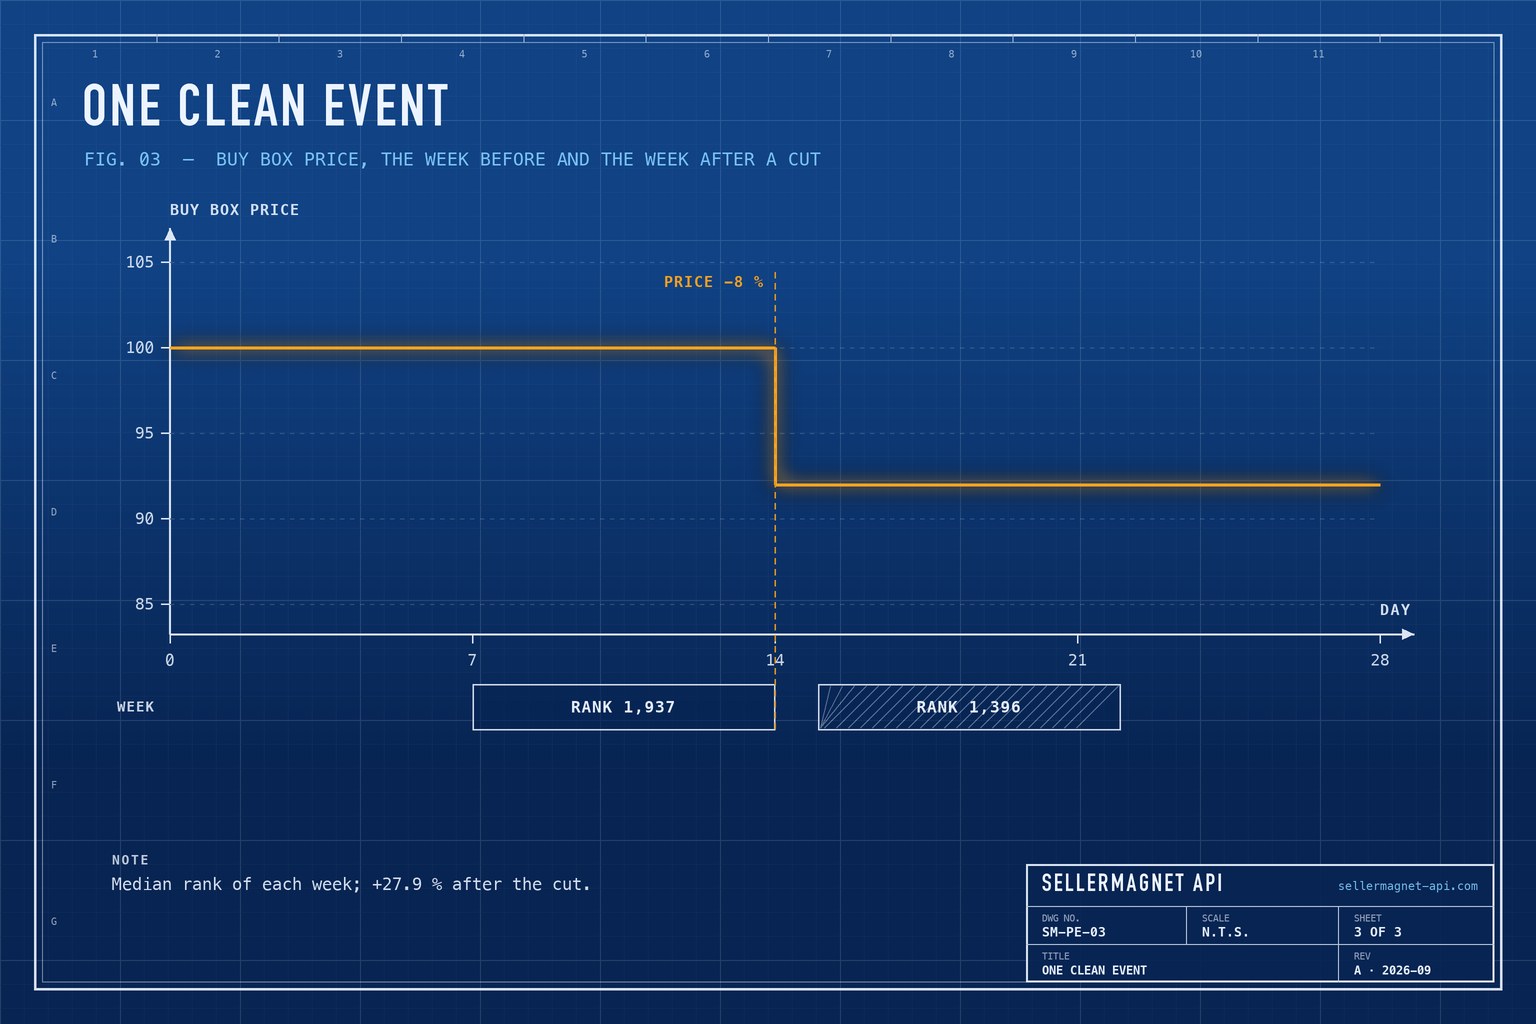
As one data point among several. In the example below, the Buy Box price fell from 100.00 to 92.00 and stayed there; the median rank was 1,937 in the week before and 1,396 in the week after - a gain of 27.9 %. The day of the change itself is left out, because both prices applied for part of that day. Across all seven cuts of this product the median gain was 37.2 % for a median cut of 10 % - about 3.7 rank points per percent of price, a rank figure, not units. The sales rank history guide explains the rank series in detail.
The two series the script reads (trimmed, illustrative values)
{
  "success": true,
  "data": {
    "asin": "B0CL61F39H",
    "stats": {
      "buyBoxPriceHistory": [["2025-05-12", 10000], ["2025-05-30", 9200], ["2025-06-30", 10580]],
      "salesRankHistory": [["2025-05-29 07:12:00", 1962], ["2025-05-31 18:40:00", 1410],
                           ["2025-06-02 03:05:00", -1], ["2025-06-02 21:30:00", 1388]]
    }
  }
}
Why one price change proves little
- Other things change the same week. A deal badge, a competitor running out of stock or the start of a season move the rank too; the seasonality guide shows when a product's season starts.
- The Buy Box price is whoever holds it. A cut can be another seller taking the Buy Box with a lower price - the repricer detection guide shows who changes prices how often.
- Gaps hide changes. The history has no entry while nobody held the Buy Box, so a price can look stable across a stock-out. A restock at a new price then looks like a strong reaction: the week before falls inside the stock-out.
- Slow weeks bounce back. Prices are often cut after a weak week, and the rank recovers anyway; rises that worsen the rank by a similar amount make the signal more credible.
- Rank is relative. A better rank means more sales than the neighbours in the category, not a fixed number of units.
Does a price cut pay off?
Only if volume rises enough to cover the lower margin. With a margin m and a cut c, both as a share of the price, a cut needs c / (m - c) more units to earn the same profit: at a 30 % margin, a 10 % cut needs 10 / (30 - 10) = 50 % more units. The rank gain says whether that is plausible; the sales estimator guide turns a rank into estimated units. A deliberate test - about two weeks at each price - is the next step for a product the history marks as price-sensitive.
Frequently Asked Questions
Does lowering the price increase sales on Amazon?
It depends on the product. Compare the sales rank in the week before and after past price cuts: if the median rank gain over at least three clean cuts is 20 % or more, the product looks price-sensitive.
What counts as a clean price change?
A Buy Box price change of at least 5 % where both the old and the new price held for more than a week, with at least four ranked days on each side.
Is a rank gain the same as more sales?
It means more sales than before relative to the category, but not a fixed number of units. How many units a rank step is worth differs between categories.
How many credits does the analysis cost?
One per ASIN - a single statistics call returns both histories - plus one for each 502 or 503 that get_with_retry() retries.
Which marketplaces are covered?
Statistics covers US, UK, DE, FR, IT, ES, JP, CA, IN, MX and BR. Set MINOR to 1 on amazon.co.jp, where prices have no minor unit.
Bottom line: one statistics call per ASIN shows how the sales rank answered every clean price change - enough to tell a price-sensitive product from one that sells for other reasons before you cut a price. A free account includes 150 credits to try it on your catalogue.


